ShaperBox 3 Bundle: The Ultimate Rhythmic Powerhouse Elevate your sound design with the ShaperBox 3 Bundle, a must-have toolkit for modern producers. This versatile collection brings together 11 powerful Cableguys effects—including Time, Pitch, Volume, and the new LiquidShaper—into one intuitive, multiband interface. Whether you're looking for precise sidechain ducking, complex rhythmic glitches, or lush analog-style filtering, ShaperBox 3 makes it easy to inject musical motion into any track. Praised by top producers like David Guetta and industry titans like Sound On Sound, it’s the definitive solution for solving mix problems and finding instant inspiration.
Mastering The Mix has done an in-depth technical analysis of the 25 most streamed songs on Spotify in 2022. We wanted to discover:
Is there a tonal balance trend?
What technical characteristics do the most successful songs share?
Are major labels optimizing their masters for Spotify?
EXPERT: Is there a trend for how loud the vocal should be in the mix?
EXPERT BONUS: Is there a Vocal tonal balance trend?
With this data, we can understand what’s been successful in the past year, and we can use that information to influence our production decisions.
Is There A Tonal Balance Trend?
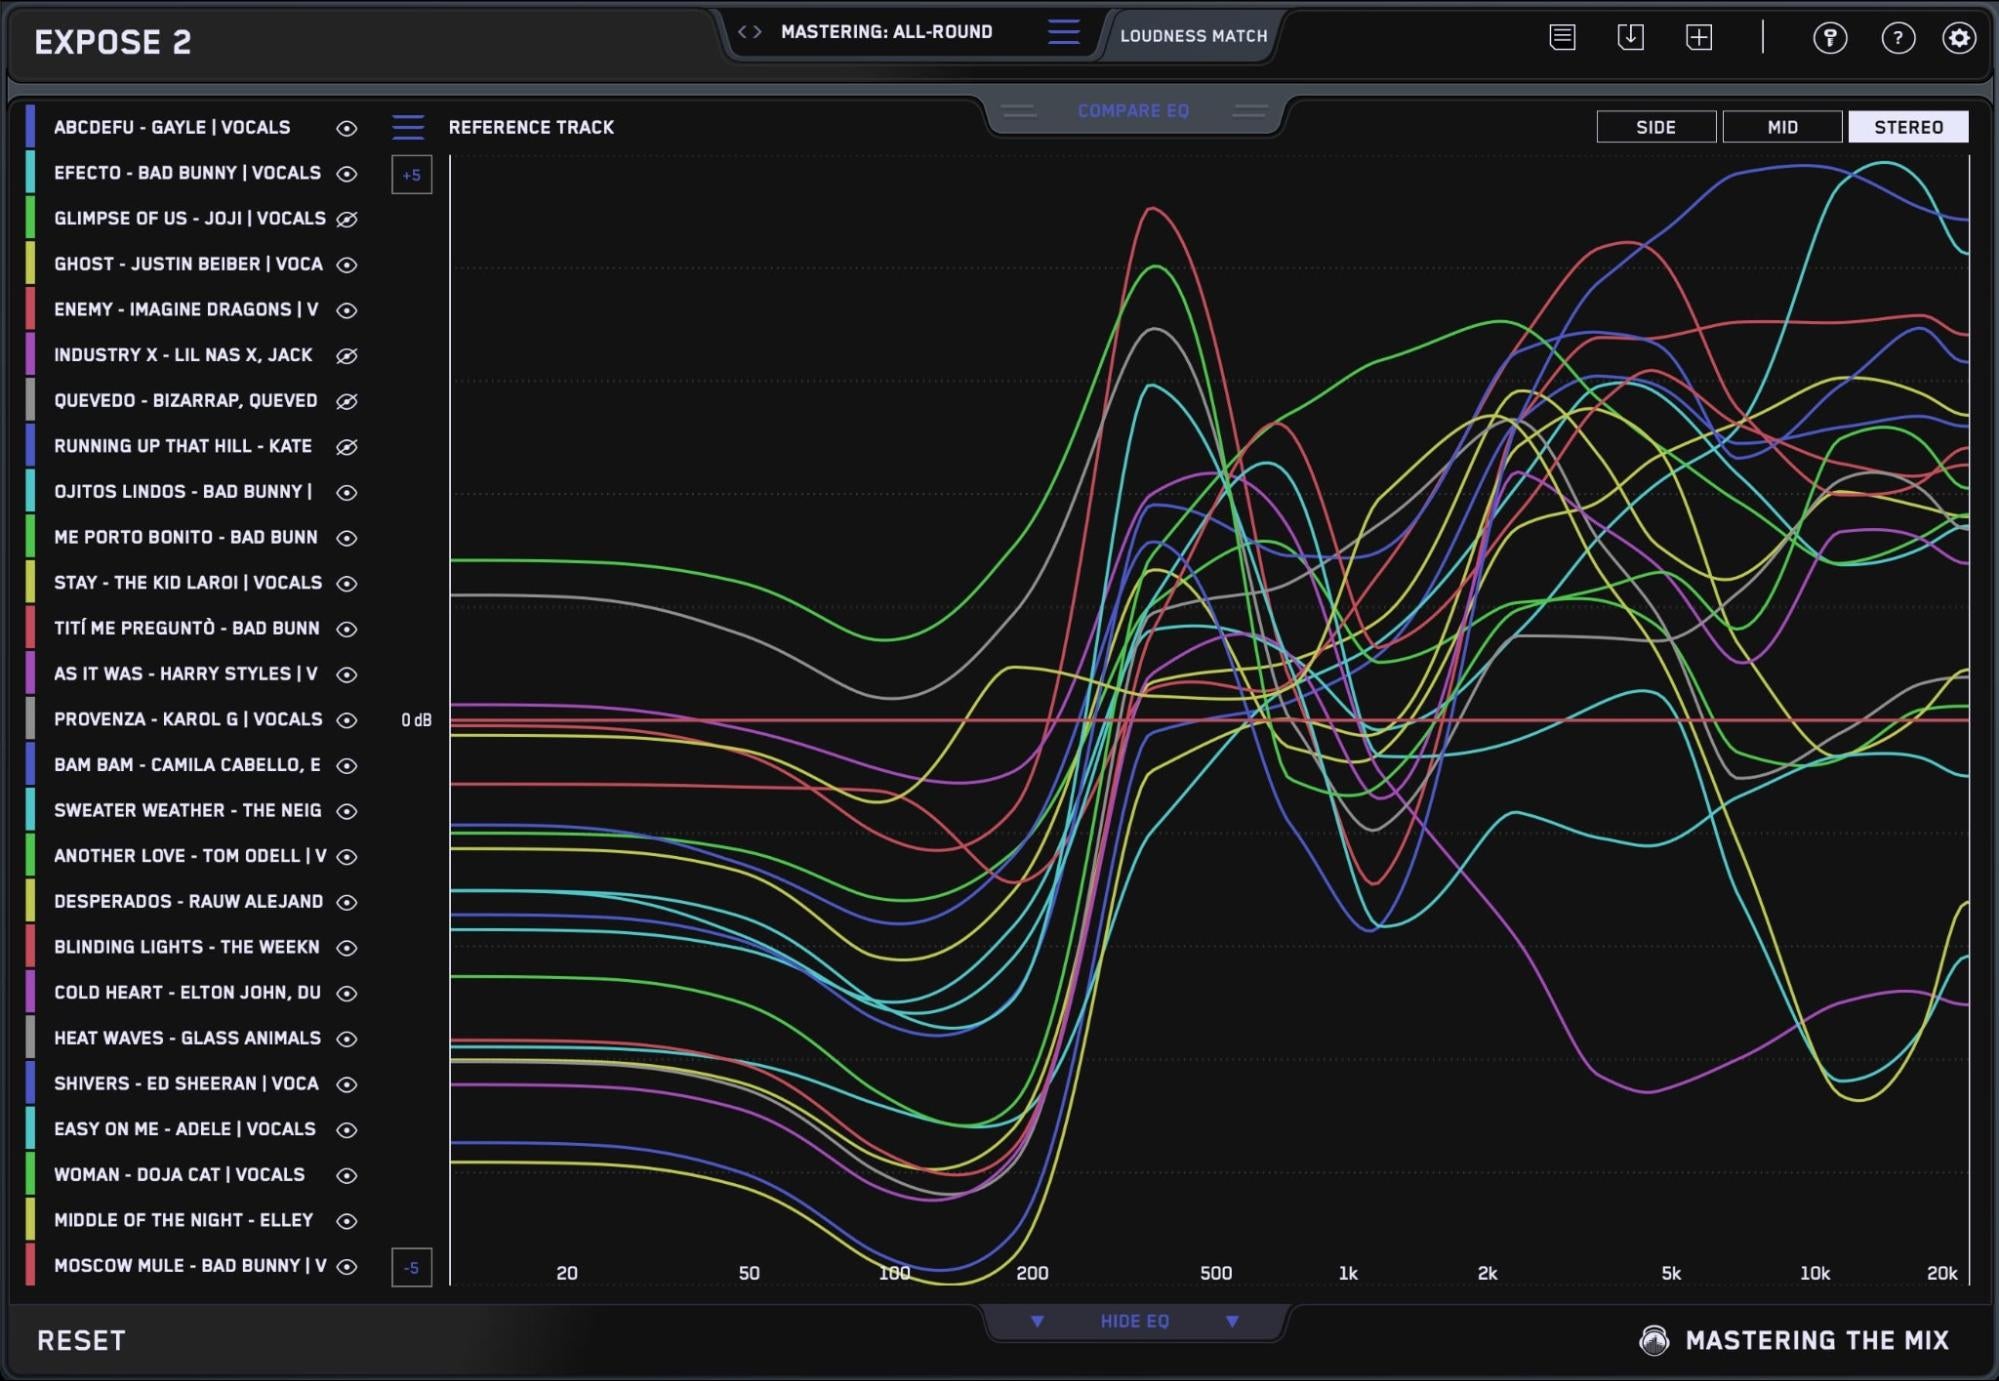
EXPOSE 2 has a useful feature called ‘Compare EQ’ which gives you the tonal balance of the loudest section of your song. This allows you to visually compare the EQ of your song to others.
In the image below, you’ll see I’ve loaded the top 25 most streamed songs from Spotify into EXPOSE for analysis.
Looking at the Compare EQ section we can see that there is a clear ball park range that all the tracks sit in. (Note the scale is ±10dB)
Across the whole frequency spectrum, the tracks are all within around ±4dB of each other. When you take into consideration all of the differences in genre, instrumentation, sound choice, vocalists ranges etc…±4dB is actually a relatively small difference.
How Can This Help Your Music Productions?
Using reference tracks to guide your decision making is crucial when making music. The fact that these 25 songs are so sonically comparable shows that there is a ball-park range that you should be within.
If your low-end was outside of this range, your track would sound weak and thin. If your high end was above this range your track could sound harsh and piercing.
Our tools, Mixroom, Bassroom, Reference, and EXPOSE 2 can all help you get the tonal balance of your mixes on point. Below I’ve linked to some more in-depth articles if tonal balance is something you want to absolutely nail:
What Technical Characteristics Do The Most Successful Songs Share?
Loudness:
Integrated LUFS is the overall loudness of the song. The closer the number is to zero, the louder the audio.
Integrated LUFS figure (Non-normalized) for the top 25 streamed tracks of 2022
Average: -8.4 LUFS Int
Loudest: -5.8 LUFS Int (AS IT WAS – HARRY STYLES)
Quietest: -13.8 LUFS Int (RUNNING UP THAT HILL – KATE BUSH)
Short-Term LUFS is a maximum figure of a moving 3 second average loudness, so basically just the loudest part of the song. The closer the number is to zero, the louder the audio.
Short-Term LUFS figure (Non-normalized) for the top 25 streamed tracks of 2022:
Average: -6.1 LUFS st
Loudest: -4.0 LUFs st (HEAT WAVES – GLASS ANIMALS)
Quietest: -9.5 LUFS st (RUNNING UP THAT HILL – KATE BUSH)
What Can We Learn From This LOUDNESS Data?
Major labels are mastering super loud. The quietest song (Running Up That Hill) was released in 1985, long before the loudness wars were kicking off. Ironically, this is the only song in the top 25 that adheres to the advice that Spotify gives to optimize their masters for streaming.
Most songs in the top 25 target -6 LUFS short-term as the loudest part of their song. As you can see in the images above, this leads to the audio getting turned down in Spotify after normalization.
If you want to master your audio to -6LUFS st max, you’re going to need a very transparent limiter that retains as much punch as possible at that loudness. Try the free trial for our plugin LIMITER which can help you get your music hitting -6 LUFS short-term whilst retaining the punch in your music.
Similarly to loudness, there are two measurements to see here. The first is true peak, which tells us the absolute peak of an audio’s waveform as it will be heard in the analogue realm through speakers. The other is simply ‘peak’ (or peak programme) which tells us the digital sample peak. True peak is the interesting figure here as it gives greater detail on whether the song is distorting when it’s played back through speakers.
The non-normalized average true peak figure was: +1.0dBTP
The non-normalized average peak figure was: 0.0dB
The normalized average true peak figure was: -4.1dBTP
The normalized average peak figure was:-4.3dB
When you upload a wav file to Spotify, they transcode it to a lossy format called Ogg Vorbis for playback so that listeners don’t have to wait for the HQ file to download. This transcoding always increases the peak. Spotify asks people to leave between 1dB and 2dB of headroom when they upload their masters, but it seems the major labels don’t bother.
Below we have the waveform of Enemy – Imagine Dragons peaking at +2.5dBTP. This is the highest peaking song amongst the 25 most streamed songs of 2022.
It’s not what audiophiles (or Spotify) recommends, but this is what the majority of major labels are doing. Ultimately, it’s your choice!
Dynamic Range:
The dynamic range measures the punch of the individual transients. The figure itself is the point of the track with the least amount of punch. The lower the number, the less punch there is. This tells us how much compression is being used in the music.
The average dynamic range for the top 25 streamed tracks of 2022 was: 6.1DR.
In our plugin LEVELS and our standalone quality control application EXPOSE the majority of the presets start to warn you of a lack of dynamic range between 5DR and 6DR. So, these tracks are pushed as loud as possible whilst trying to hold on to as much punch as they can.
Loudness Range:
The loudness range tells us the difference in loudness between the various sections of the song, like how loud the chorus is compared to the verse. The larger the number, the greater the variation.
If there is a big difference in loudness between the various sections of your track then your loudness range will be a higher number.
If the loudness of the various sections in your track are very similar or equal, the loudness range will be smaller.
A loudness range between 6 LU to 12 LU shows that a track has a considerable difference in loudness between the various sections.
Tracks with a loudness range below 4 LU could be considered rather static in loudness.
The average loudness range for the top 25 streamed tracks of 2022 was: 6.7LU.
This shows that a significant difference between verse and chorus is preferred here. Producers are shooting for a loud impactful chorus whilst keeping their verses quieter and more dynamic.
Note: As of 2023, Spotify normalizes all audio to -14LUFS Integrated by default in desktop and mobile apps. If you go into settings, you can adjust the playback settings. There is also a Spotify Loud option which plays back at -11LUFS int, as well as a Spotify Quiet which plays back at -19LUFS int. Additionally, you can turn off normalization completely.
Are Any Of The Top 25 Most Streamed Tracks Optimized For Spotify?
This is a short answer: No. The exception being Running Up That Hill by Kate Bush which was released in 1985.
Is There A Trend For How Loud The Vocal Should Be In The Mix?
The topic of balancing channels fascinates me. The volume of a channel has a huge effect on its overall sound, especially when adjusted in the context of the whole mix.
For example, when you increase the volume of a channel, that can make it sound brighter as if you’ve added a boost to the high frequencies. You can also make it sound less bright and distant by turning it down.
The first step in creating a pro-sounding mix – before you reach for a compressor, EQ, or any other plugin – is to ensure the volume of each element in the mix is well balanced.
So, with this in mind, how does the vocal volume in the context of the whole mix compare across these top 25 songs on Spotify?
It turns out that they are incredibly similar! If you remove 4 outliers, then the vocal loudness relative to the whole mix for 21 of the 25 songs are within ±1.5dB of each other!
How can you set the perfect vocal level in your mix?
The integrated loudness of the vocal was an average of 4.5 LUFS Int less than the overall LUFS int for the whole track. To get your vocal level in this range, you need your vocal to be between 3 to 6 LUFS quieter than your full mix (including your vocal).
Here’s how you can do it quickly:
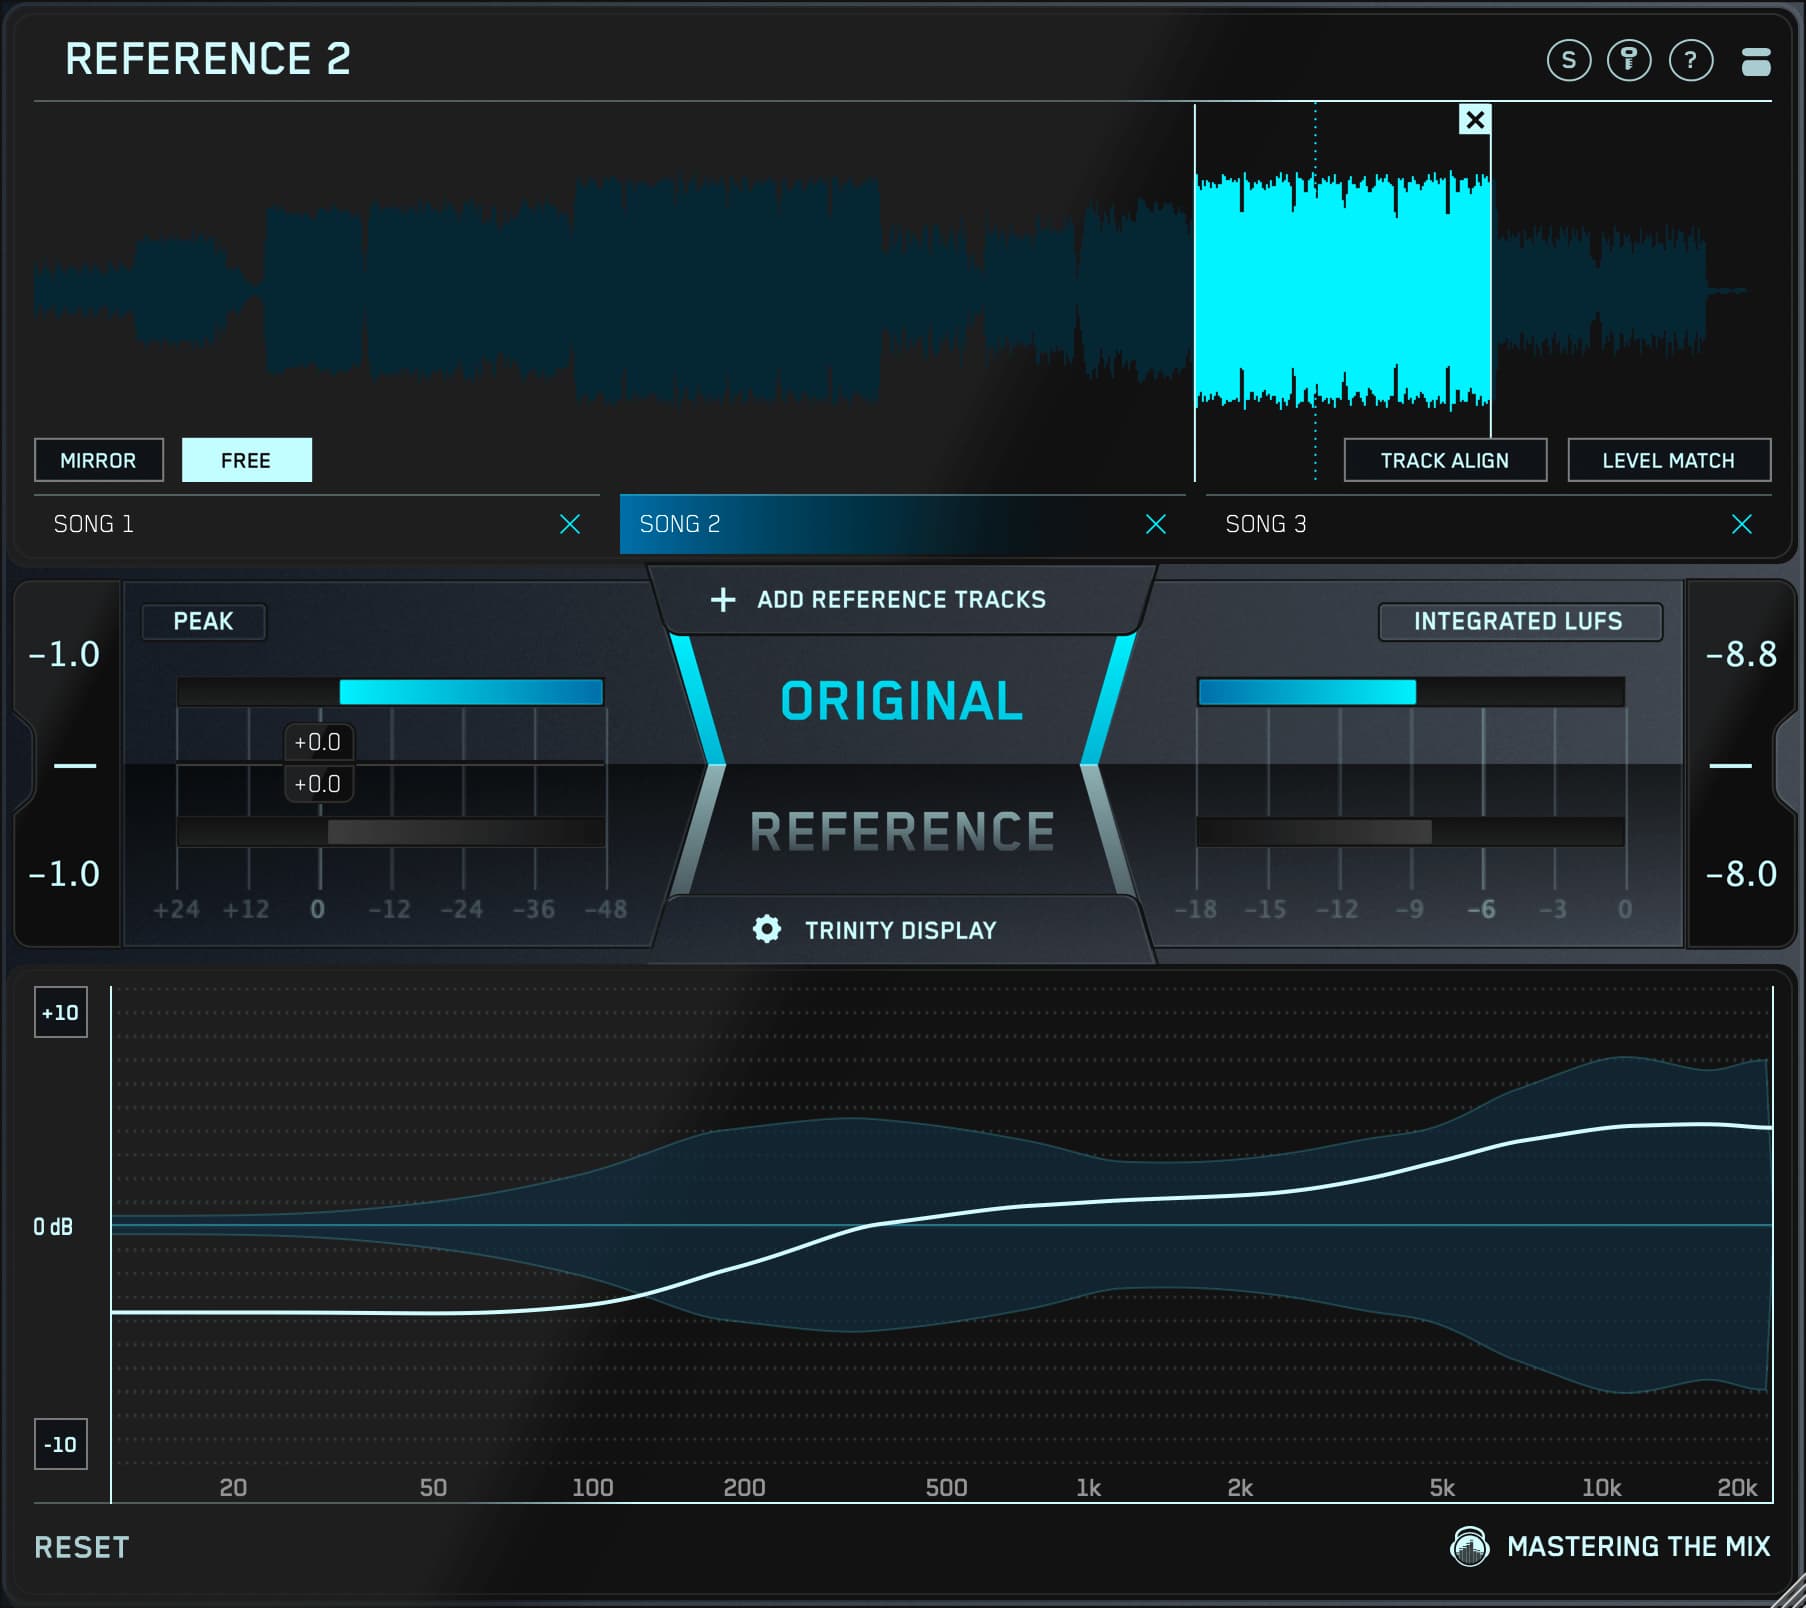
Import both your full bounce and your vocal stem into EXPOSE 2.
Check the INT LUFS readings.
The vocal should be between 3 to 6LUFS quieter than the full track. Adjust your vocal in your DAW using a gain plugin as is necessary.
BONUS: Is There A Tonal Balance Trend For Vocals?
Interestingly, again we see a common trend amongst the vocal tonal balance across all tracks. This is EXPOSE 2 with the scale at ±20dB. We can see the EQ curves are fairly well bunched together.
Let’s zoom in to a ±5dB scale and unpack the data.
We can ignore 0-200Hz. Different producers have different approaches to whether they should cut, reduce, or leave the low-end of the vocal.
From 500Hz to 20kHz we can see the EQ lines are all roughly within around ±3dB of each other. Keep in mind there is no genre separation here or accounting for different vocal ranges, or even rapping.
The point to remember here is that whilst we all have creative control over our mixes and masters, ultimately there is an acceptable ‘range’ where all songs seem to sit. If you’re outside this range, your mix is probably missing the mark.
I created this video below to help you get your vocal tonal balance sounding perfect.